Data Led Growth project | Pentland
Problem Statement: Decrease the D2C Cancellation Rate across the Pentland Brands from ~4.5% to 2.5%

Overview:
Pentland Group is a British privately held global company that owns and invests in, primarily, retail and wholesale businesses in the sports, outdoor and sports fashion sectors. It houses famous brands like Speedo, Berghaus, Canterbury of New Zealand, Endura, Ellesse, Red or Dead, KangaROOS and Mitre.
Though it is majorly a B2B wholesale player, it plans to grow the D2C revenue contribution 6x from the current 5% in the next 3 years. We assume that it also wishes to solve for the Cancellation across its brands through the D2C channel.
This document will give an executable strategy for the Pentland Brands Digital Growth team to firstly identify the cancellation rate pattern across the brands and diagnose the reason behind it. Secondly, solve for it using proposed experiments. Kindly note the scope of this document only includes the sales and UI/UX side of the website and not the supply chain and inventory reasons behind the cancellations.
Hypothesis:
If we solve for the brands in the portfolio that have an opportunity to bring down or control the cancellation rate, then we are already control any possible bottom-line (cancellations) bleed which might be upcoming, with increased focus on acquisition; due to the healthy customer behavior being built from the beginning
Goal of the experiment:
Given the diversity of the brands, under the D2C Pentland Brands umbrella, identification of the right problem and diagnosis becomes crucial. Hence, we will start with the application of Rate and Mix to understand which brands need a focus on the D2C cancellation rate. This will be followed by experiments to solves towards the cancellation and overcome the specific reasons for each of the brands.
Success Metrics:
A way to measure success for the experiment would be the overall D2C cancellation rate falling below 2.5% (~2021 levels) with increased volume.
Context:
It showed the below trends across the last 3 years.
Cancellation % | 2021 | 2022 | 2023 |
| Berghaus | 1.25% | 3.99% | 5.68% |
| Canterbury | 10.68% | 2.02% | 1.76% |
| Ellesse UK | 4.67% | 42.08% | 9.92% |
| Endura Sport | 4.40% | 3.61% | 1.95% |
| Kickers | 5.05% | 7.13% | 5.99% |
| Speedo | 1.31% | 2.90% | 2.18% |
2.43% | 7.03% | 3.19% |
Worst Case Scenario: Cancellation Rate goes up back to 4% or above
Best Case Scenario: Cancellation Rate goes down to 2.5% or less
Diagnosis:
To understand an RCA:
- What is happening?
- Why is it happening?
Applying the Rate and Mix Framework to understand if cancellation rate is changing or showing a pattern across the brands or composition of sales volume across brands has any impact.
Here,
Mix: Brand Contribution % for a year
Rate: Cancellation % of a brand for that year
Taking the last 3 years of data for the 6 major brands under D2C channel:

It can be clearly seen that on comparing year 2022 over previous year 2021 we can see that the overall contribution of mix was positive while that of cancellation was negative with an increment of cancellation rate by 4.6%. This was led by Ellesse UK (maybe an exceptional event with only 58% of the orders dispatched, and followed by Speedo and Berghaus.
Though the impact of Mix was positive but the overall acquisition for Speedo and Berghaus can be monitored to ensure a continued positive impact.

However, as we see from the 2023 v/s 2022 data, we see that there was again an exceptional drop in Ellesse UK Mix which led to a different focus area for 2023. Though across both mix and rate we see Berghaus can be actioned upon for both Cancellation Rate increase (0.21%) and a slight fall in the Mix (Brand Contribution %). Similarly, the Cancellation Rate for both Speedo and Endura can be

Experiment Design:
What are we testing and the Variation Design?
Knowing where to solve for, next step to pick up on is What to solve for. This can be further used to design and run experiments, as part of the solution.
Some of the basics which can be experimented upon for the above identified brands are listed below. However, how to identify and priorities the list of these experiments will depend on:
- User Feedback (through surveys, website heatmap, NPS scores, etc.)
- Drop in the funnel conversion
- CTR
Disclaimer: The below list is on a general basis due to lack of the above information
Product Information
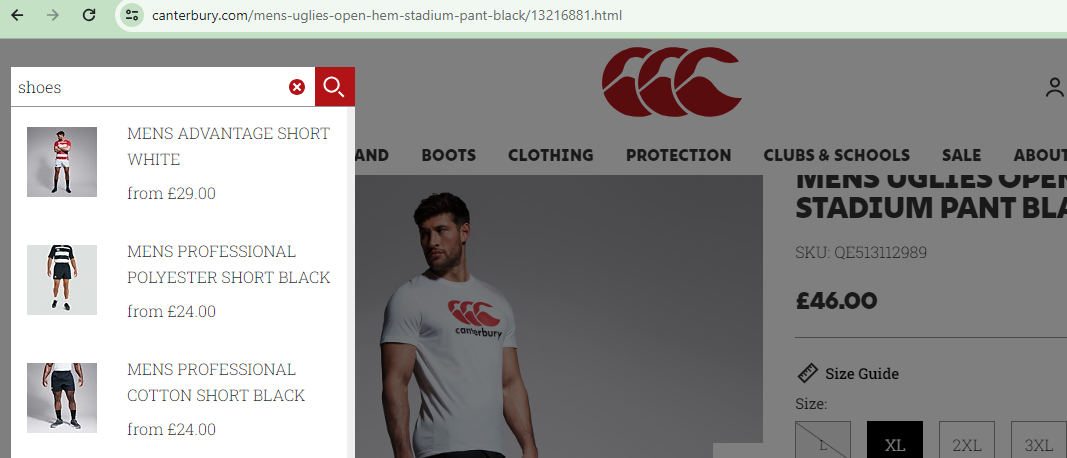
To eliminate mismatch between the product showcased and received by the customer, a clear display of product description, quality of images, videos, size guides, material information or usage guide can be experimented across different versions.
Example: There's already another product recommendation available in parallel to the product information space. This can be moved at the bottom or to the checkout place to test around

Source: Link
Impact: High
This can also be different for different brands based on their functionality and requirement to be more explicit. Hence, can have higher impact to differentiate between the brands
Stock Information
Currently no stock information can be seen, which may cause company or customer initiated cancellation due to the lack of available size/style variant.
Below is an example of good flow with Amazon which clearly highlights the In Stock option.
It can also be used to drive the option of creating the FOMO-led-demand with displays like "Last few stocks available"

Impact: Low
This can also be different for different brands based on their functionality and requirement to be more explicit. Hence, can have higher impact to differentiate between the brands
Hidden Costs
The earlier all the prices are displayed, the better the funnel health is.
Example: The additional fees shows to be calculated in the next steps. This can include delivery fee, as well as any international costs

v/s this is shown on the PDP itself at Amazon, clearly highlighting the Shipping and Import amount based on the pin code selected

Impact: Low (for the above use case, though High overall)
Since all the brand websites show a similar behavior this can't be a differentiator for the brands identified above, even though overall this would improve the funnel
Checkout Flow
Based on the distribution of user traffic across website, and mobile site, the checkout flow can be tested. Features like Autofill, Enabling Guest check (already seen), SSL certificate during checkout, varied payment options, progress indicator, etc. can be tested


Impact: Low (for the above use case, though High overall)
Since all the brand websites show a similar behavior this can't be a differentiator for the brands identified above, even though overall this would improve the funnel
Personalization and recommendation
This is applicable across the funnel (on the recommended products, search option, campaign based on user browsing or purchase history, etc.)
Example: Search has a high visibility at the top left of the homepage, it can make use of algo-based personalization and recommendations

Audience and Sample Size
To consider audience for any of the above experiments, the below needs to be considered:
- Experiment needs to be conducted on a similar geography audience. Eg: Control and Test need to be of the same country (UK, IT, ES, FR, etc.)
- Given the current volume, the experiment duration should be of at least 4-6 weeks to achieve statistical significance
Implementation and A/A Test
To test the platform efficiency and validating the experiment set up, 2 identical versions of the experiment can be run to baseline against each other.
Post Experiment:
Experiment Result
Post the experiment results, the implementation can be prioritized based on the Cost-Benefit Analysis
Release Decision
The new implementation can be released based and taken up as:
- Scale - For successful experiments with statistical significance,
- Kill - For unsuccessful experiments with statistical significance
- Continue - For experiments yet to achieve statistical significance
Learnings
Learnings across different features impacting the cancellation. Though the above experiments have a cancellation view. It can be used to impact other metrics too like:
- Incremental Revenue Targets
- Impressions,
- Conversion,
- Return Rates,
- Bounce Rate,
- Customer Lifetime Value,
- Customer Acquisition Cost,
- AOV (Average Order Value)
- Etc.
Next Steps
The experiments can be scaled across the various granular aspects like:
- Region -> Country-specific experiments
- Hyperlocal marketing strategies and understanding their RoI
- Stock Management
It can also be scaled across different other Primary Metrics as stated in the learnings.
Stakeholder Management:
Whom:
The Digital Growth Team would be the main stakeholder for these metrics. These experiments can run hand to hand along with the acquisition target for the team, to increase the D2C revenue contribution.
Where:
Digital Experiment Wheel - There can be an on-going forum between the Digital Growth and Analytics team where the experiments are listed and prioritized.
What:
- The status and results of the on-going experiments, with the buy in from the stakeholders on the Scale, Kill and Continue
- The upcoming experiments on the basis of metrics to be prioritized at the brand and regional level

Brand focused courses
Great brands aren't built on clicks. They're built on trust. Craft narratives that resonate, campaigns that stand out, and brands that last.


All courses
Master every lever of growth — from acquisition to retention, data to events. Pick a course, go deep, and apply it to your business right away.


Explore courses by GrowthX
Built by Leaders From Amazon, CRED, Zepto, Hindustan Unilever, Flipkart, paytm & more
Course
Advanced Growth Strategy
Core principles to distribution, user onboarding, retention & monetisation.
58 modules
21 hours
Course
Go to Market
Learn to implement lean, balanced & all out GTM strategies while getting stakeholder buy-in.
17 modules
1 hour
Course
Brand Led Growth
Design your brand wedge & implement it across every customer touchpoint.
15 modules
2 hours
Course
Event Led Growth
Design an end to end strategy to create events that drive revenue growth.
48 modules
1 hour
Course
Growth Model Design
Learn how to break down your North Star metric into actionable input levers and prioritise them.
9 modules
1 hour
Course
Building Growth Teams
Learn how to design your team blueprint, attract, hire & retain great talent
24 modules
1 hour
Course
Data Led Growth
Learn the science of RCA & experimentation design to drive real revenue impact.
12 modules
2 hours
Course
Email marketing
Learn how to set up email as a channel and build the 0 → 1 strategy for email marketing
12 modules
1 hour
Course
Partnership Led Growth
Design product integrations & channel partnerships to drive revenue impact.
27 modules
1 hour
Course
Tech for Growth
Learn to ship better products with engineering & take informed trade-offs.
14 modules
2 hours
Crack a new job or a promotion with ELEVATE
Designed for mid-senior & leadership roles across growth, product, marketing, strategy & business


Learning Resources
Browse 500+ case studies, articles & resources the learning resources that you won't find on the internet.

Patience—you’re about to be impressed.